Commodities: Opportunities & Considerations for 2025 & Beyond
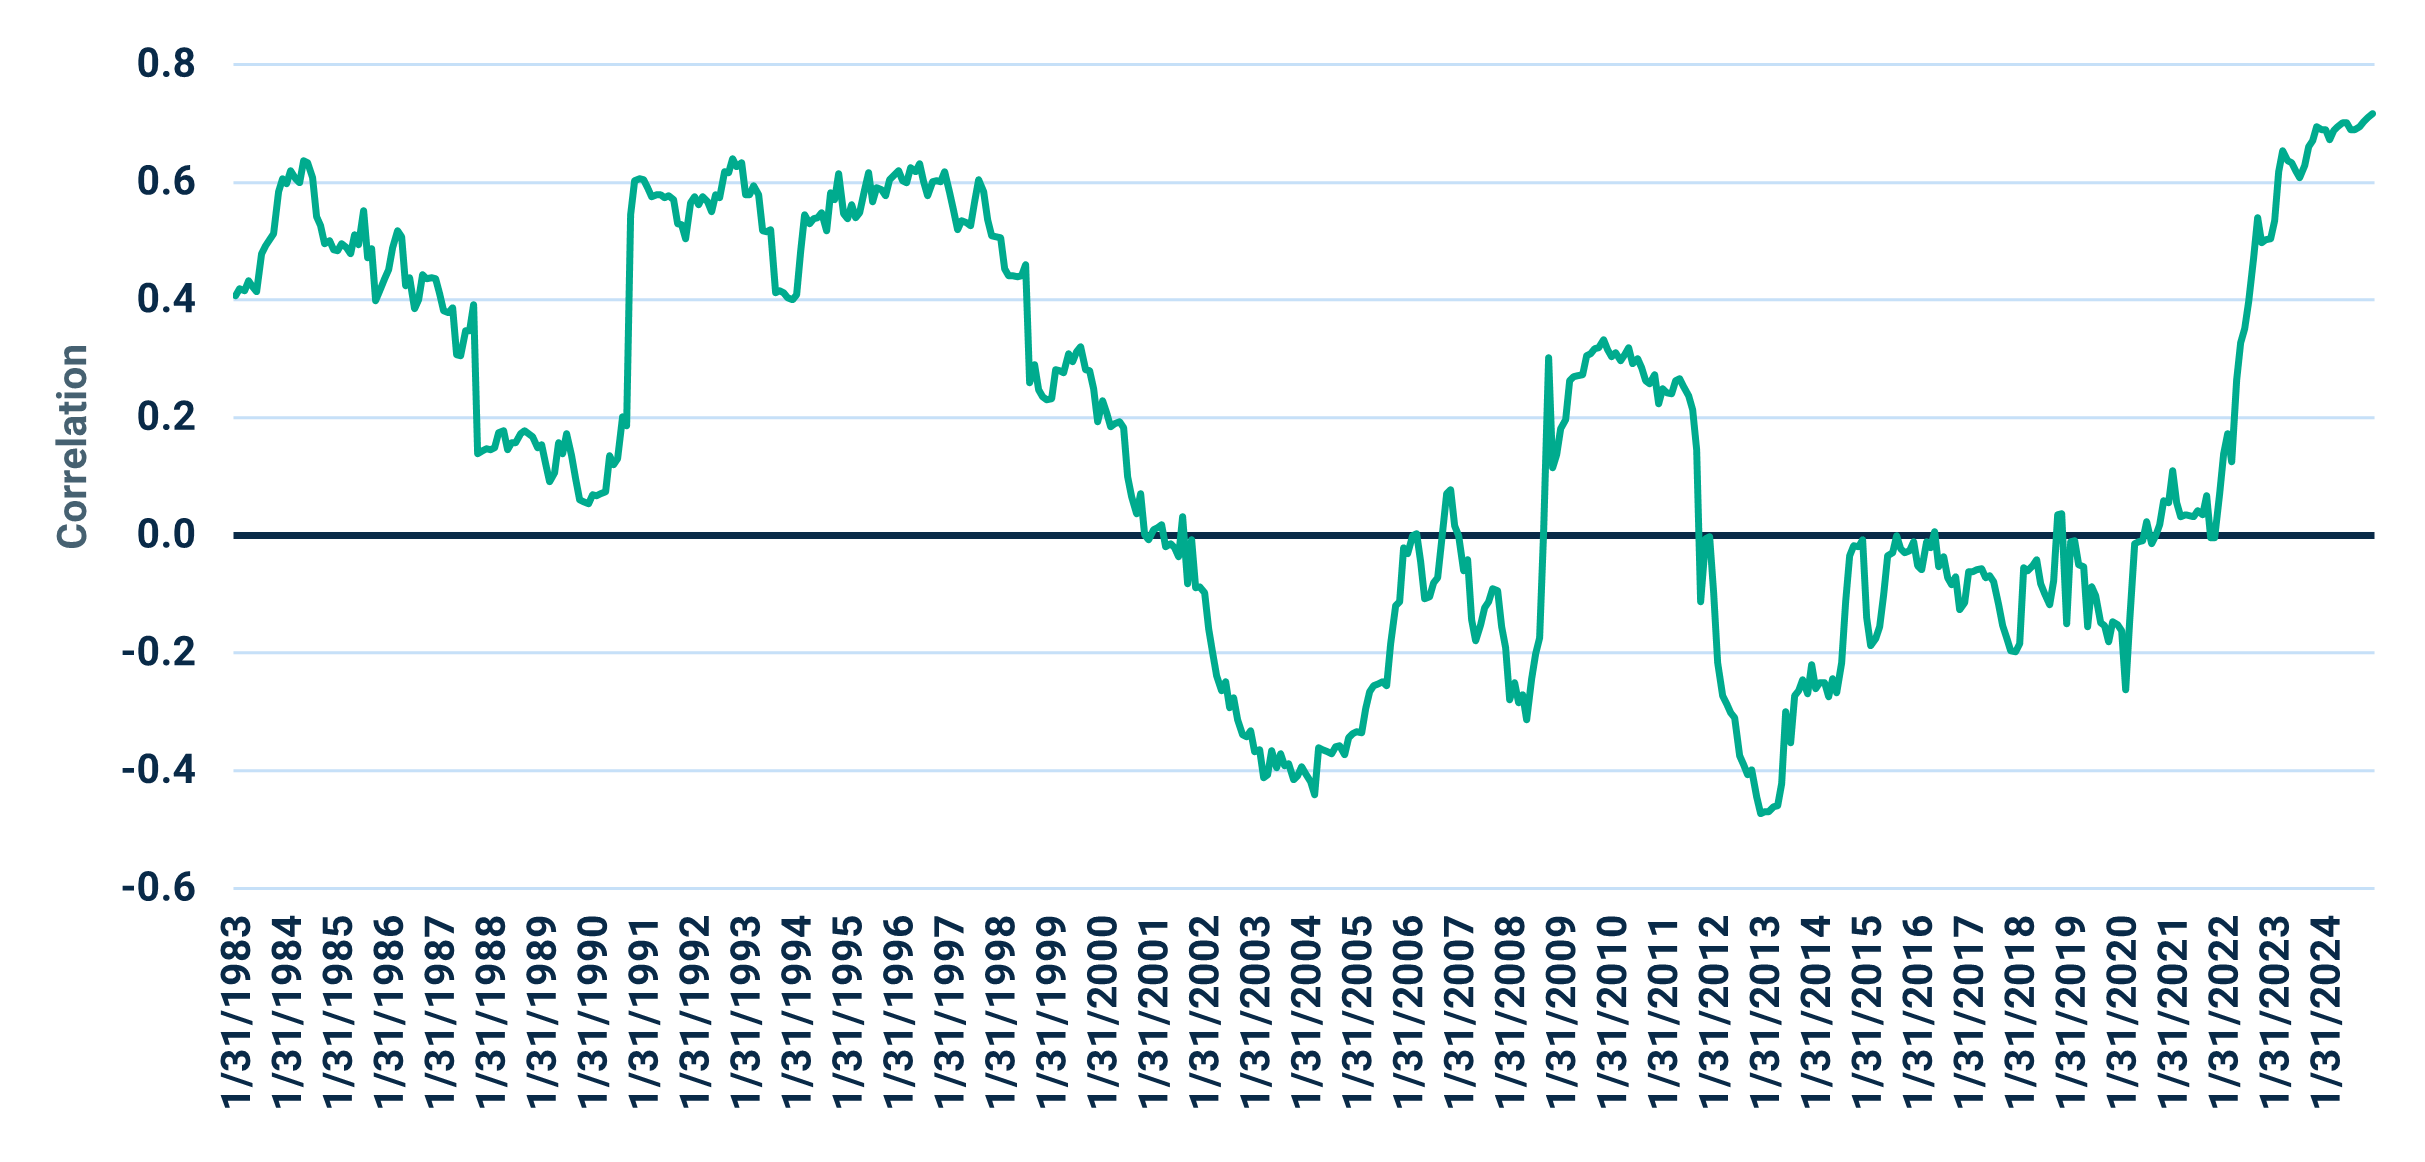
January 14, 2025- Historically, stocks and bonds haven’t always demonstrated negative correlations as they did for much of the last two decades.
- For example, the average rolling 3-year correlation between the Bloomberg US Agg and S&P 500 was 0.4 for the period from 1980 to 2001.
- In the roughly 20-year period that followed, stocks and bonds exhibited an average rolling 3-year correlation of -0.1.
- Within this environment, broad based commodity indices (such as the Bloomberg Commodity Index)lagged equity and fixed income markets.
- We believe we have transitioned to a new regime marked by higher inflation and interest rates. The average rolling 3-year correlation between stocks and bonds since the beginning of 2022 has been 0.6.
| 1999-2001 | 2002-2021 | 2022-Present | |
|---|---|---|---|
| Average 3 Yr Rolling Stock/Bond Correlation | 0.4 | -0.1 | 0.6 |
Jan 1980 - Dec 2024 (Computed Monthly)
Source: Morningstar Direct.
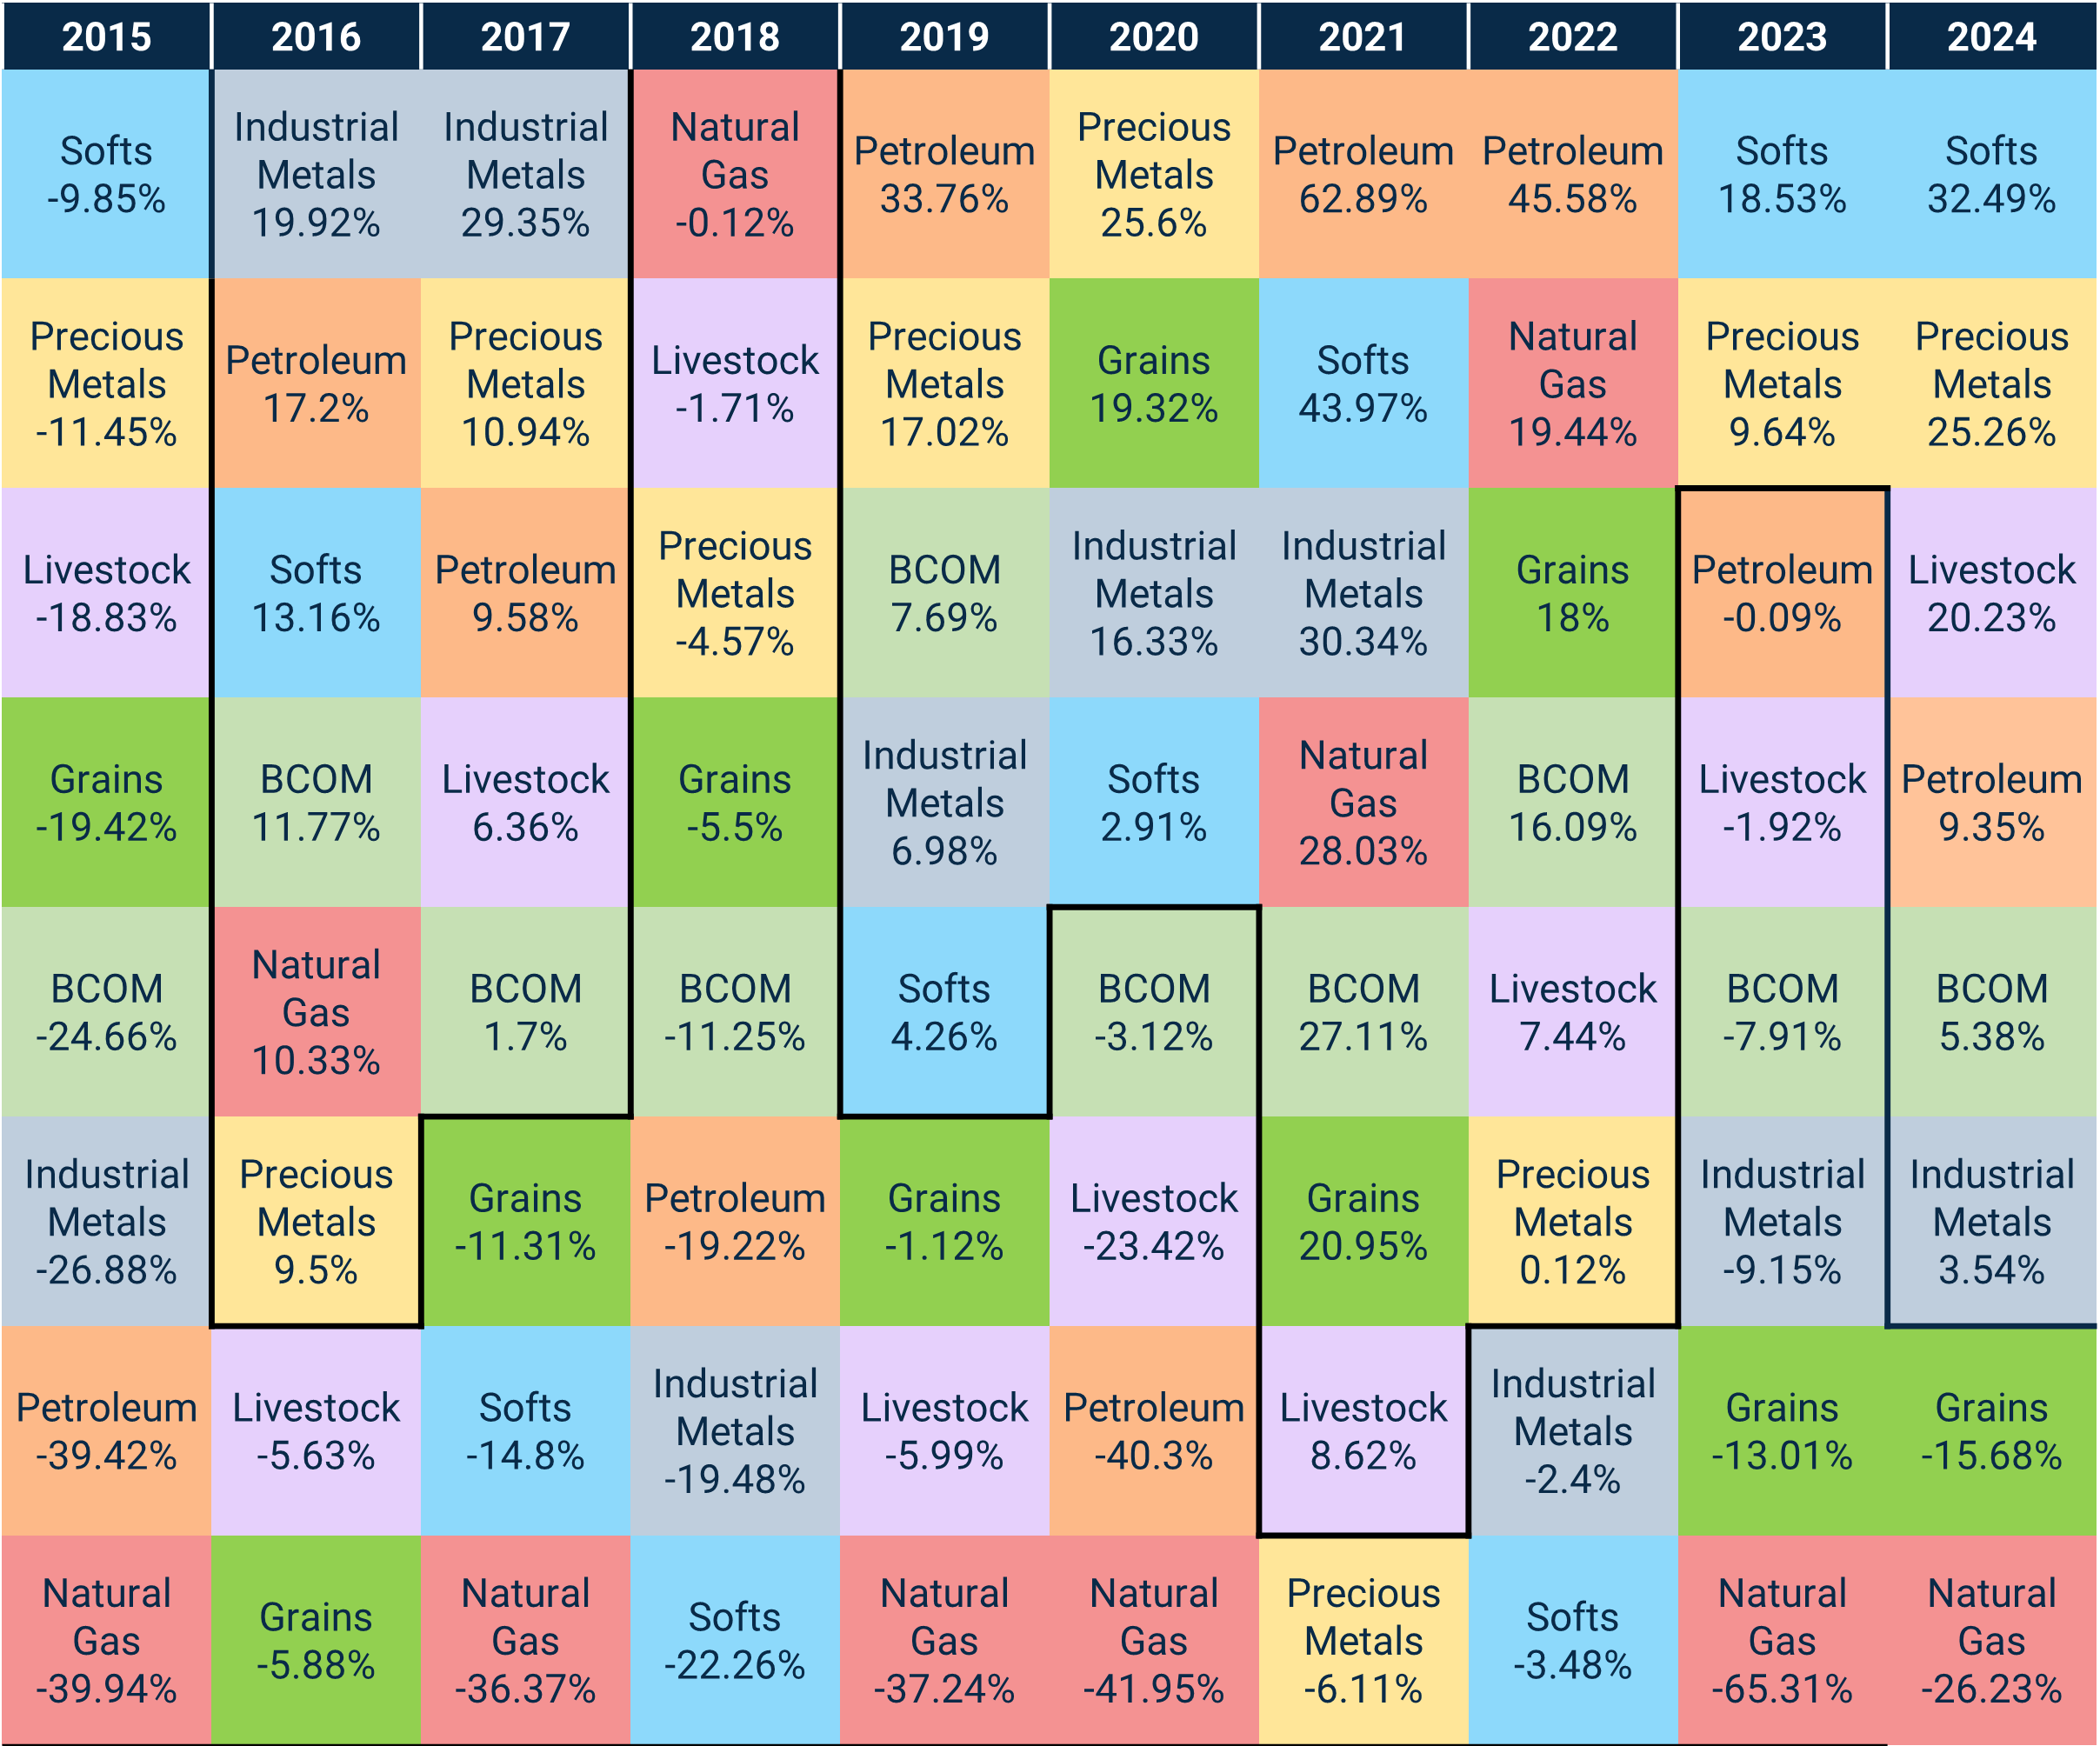
- Historically, returns across commodity sectors have been highly divergent.
- The last decade has lacked a consistent pattern of leaders or laggards.
- The average calendar year spread between the top and bottom performing commodity sectors was 53.8% over the past decade.
Source: Morningstar Direct. Commodity returns reflect those of Bloomberg Commodity Sub Index returns.
Performance data shown represents past performance and is no guarantee of future results.
- Timing individual commodities has proven difficult, and investors have struggled to do so successfully, in our view.
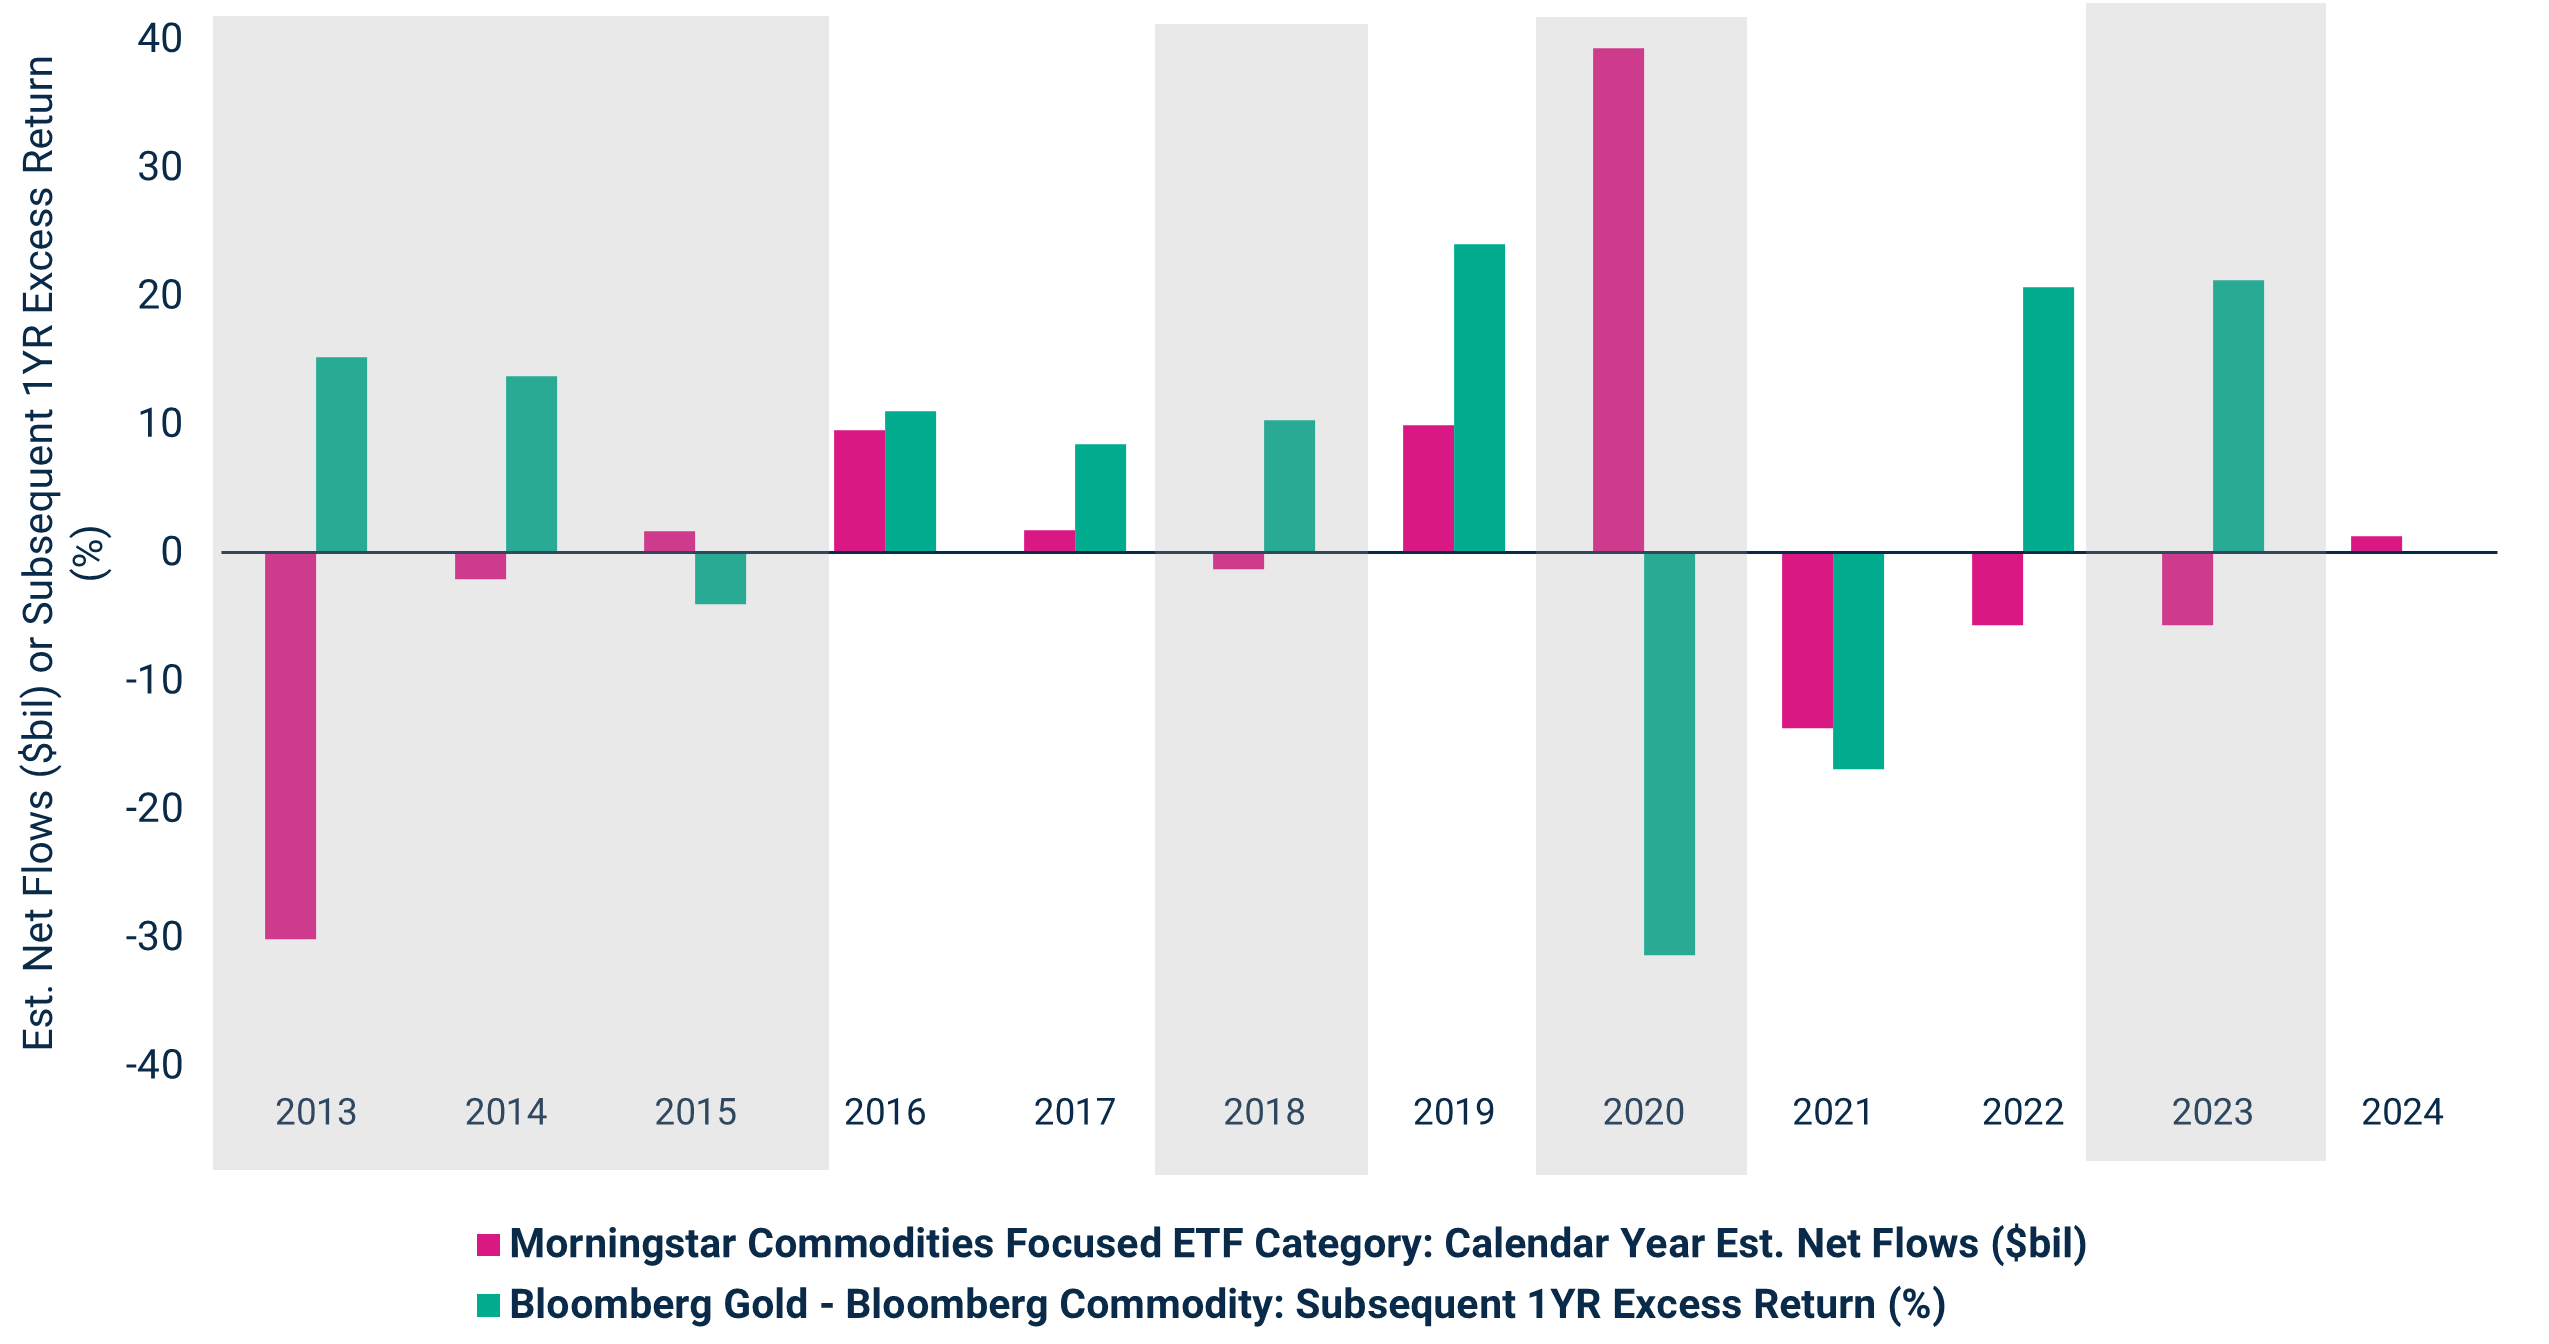
- Commodities-focused investors have only timed gold performance in four of the last 11 calendar years when comparing calendar year estimated net cash flows versus gold’s subsequent 1-year excess returns.
- For example, 2013 saw the largest investor outflows while gold meaningfully outperformed broader commodities in 2014. Even more stark, in 2020, investors piled into gold as it vastly underperformed broad commodities in 2021.
- More recently, investor outflows in 2022 and 2023 were followed by strong gold outperformance to broad commodities in 2023 and 2024.
Bloomberg Gold TR USD - Bloomberg Commodity TR USD: Subsequent 1YR Excess Return
2013 - 2024 (Computed Annually)
Source: Morningstar Direct.
The flows shown in the chart on this slide are reflecting US ETFs in the Morningstar Commodities Focused Category. This category is used because gold represents the vast majority of assets in the group (>97% of assets). As a result, Harbor used this category as a reflection of flows in and out of gold. In this way, we illustrate the net flow activity surrounding gold (using Morningstar Commodities Focused ETF Category given >97% of its asset base is comprised of gold ETFs) alongside relative performance of gold to broad commodities (Bloomberg Commodity Index) in the subsequent year.
Performance data shown represents past performance and is no guarantee of future results.
- Given that commodity prices are mainly driven by the balance of supply and demand, they have generally been less sensitive to stock and bond market returns.
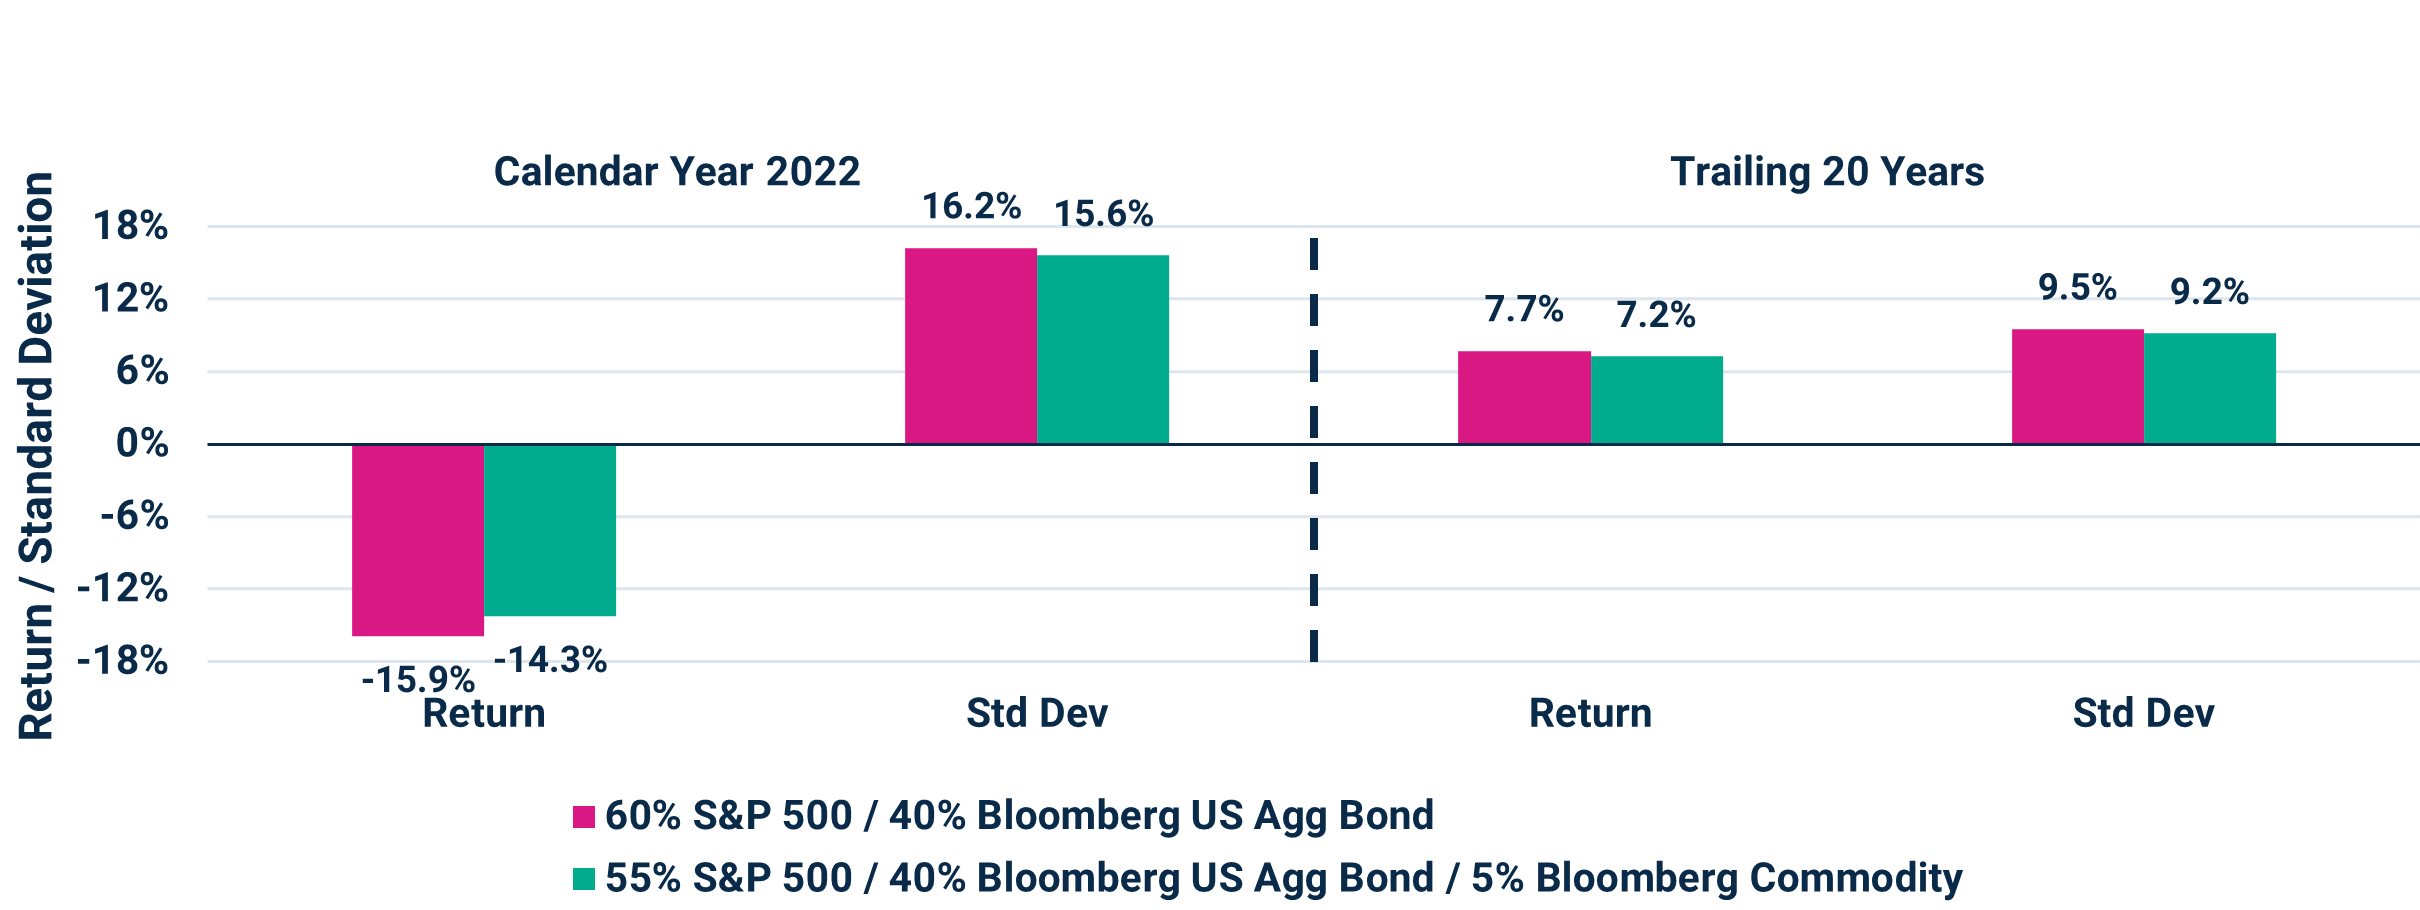
- Including commodities with a 5% weighting within a 60/40 portfolio at the expense of equities has reduced overall portfolio volatility across all represented annualized time periods, serving as a risk dampener within a portfolio of stocks and bonds.
As of 12/31/2024

- In the “Perfect Storm” year for 60/40 portfolios in 2022, allocating 5% to commodities would have reduced volatility and notably aided portfolio returns.
- On a longer-term basis, this 5% allocation would have dampened overall volatility and had a negligible impact on returns.
2022 & Trailing 20 Years Ending 12/31/2024
Source: Morningstar Direct. Performance data shown represents past performance and is no guarantee of future results.
- One of the challenges of investing in commodity futures is that the cost of ownership, or roll yield, often erodes returns.
- The Bloomberg Commodity Spot Index represents an uninvestable index of commodity spot prices (investors incapable of purchasing 500 cattle at a spot price, for example).
Jan 1991 - Dec 2024
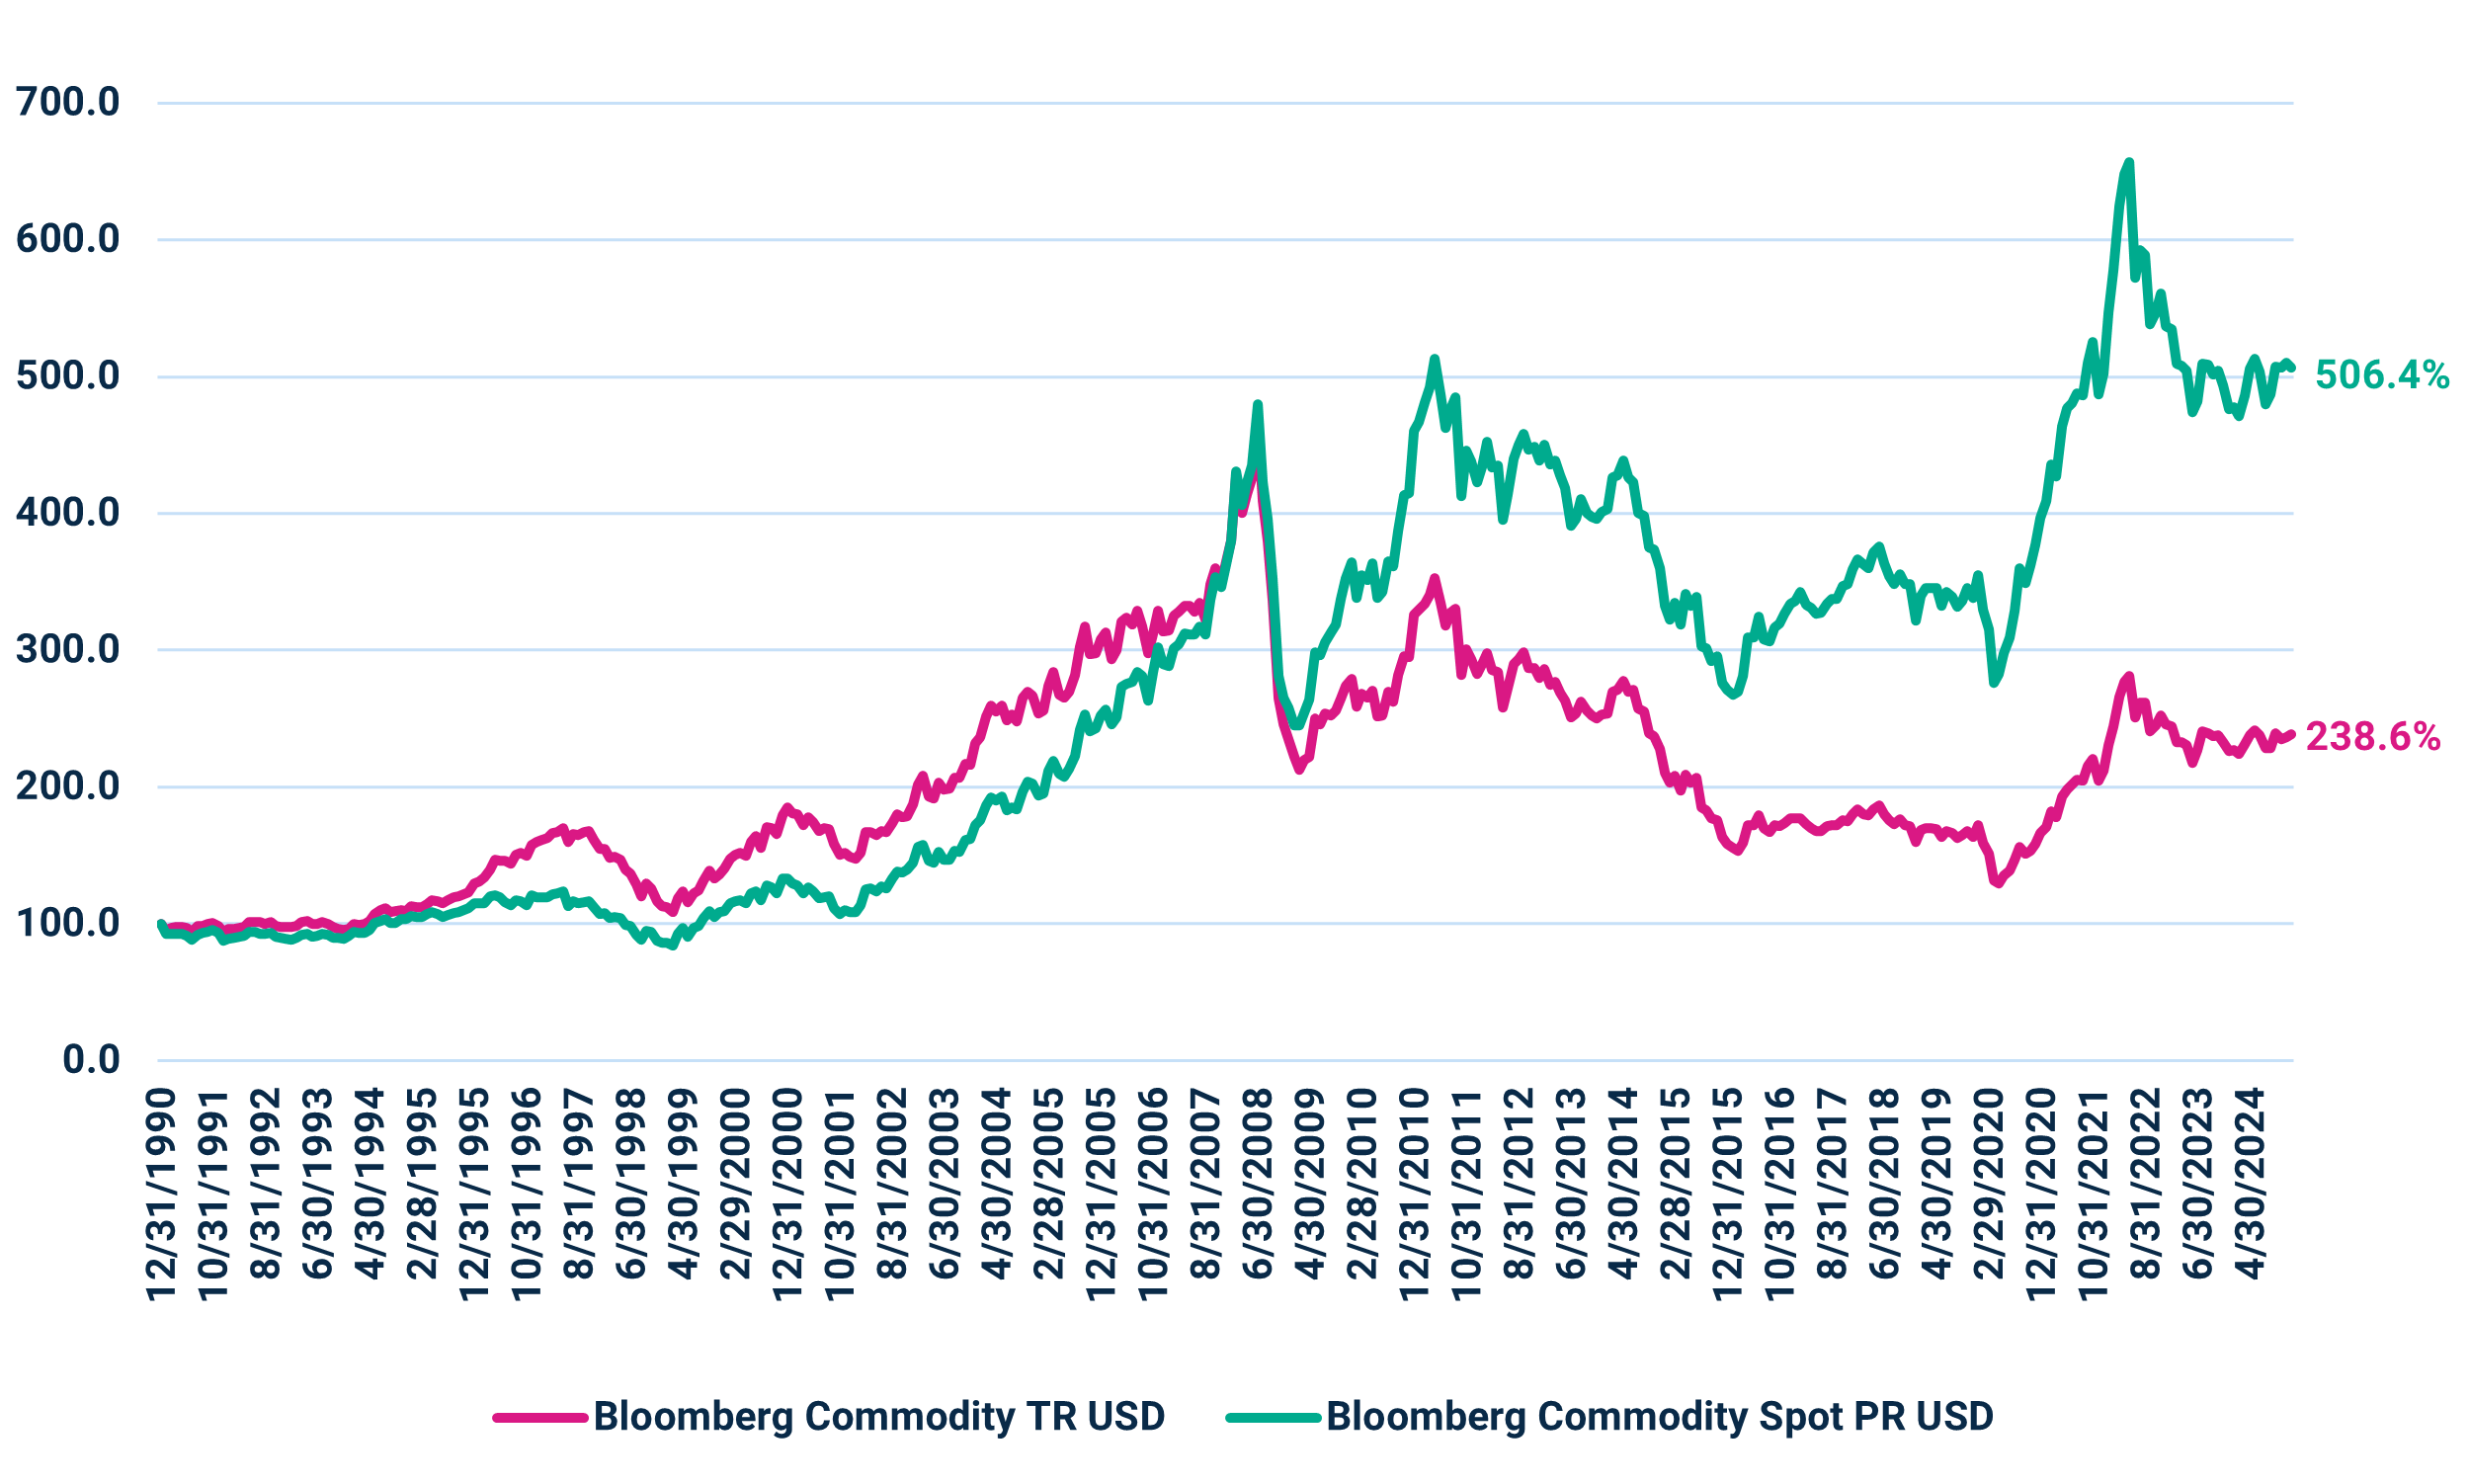
As of December 31, 2024.
Source: Morningstar Direct, FactSet
Performance data shown represents past performance and is no guarantee of future results.
- Natural Gas represents a commodity with very poor cost of ownership dynamics given the expenses and challenges of storing and transporting the commodity.
- From its January 2006 inception, the Bloomberg Sub Natural Gas TR Index has returned -32% annualized through December 2024.
- Conversely, because of tight inventories the futures curves of many commodities are in backwardation, offering positive carry.
- Gasoil is an example of a commodity currently in backwardation with a downward sloping futures curve.
Jan 2006 - Dec 2024


As of December 31, 2024.
Source: Morningstar Direct, FactSet
Performance data shown represents past performance and is no guarantee of future results.
Important Information
The views expressed herein may not be reflective of current opinions, are subject to change without prior notice, and should not be considered investment advice or a recommendation to purchase or sell a particular security.
The Bloomberg US Aggregate Bond Index is an unmanaged index of investment-grade fixed-rate debt issues with maturities of at least one year. This unmanaged index does not reflect fees and expenses and is not available for direct investment. The Standard & Poor's 500 Index (S&P 500) is an unmanaged index generally representative of the U.S stock market. The Bloomberg Commodity Spot Index measures the price movements of commodities included in the Bloomberg CI and select subindexes. The Bloomberg Sub Natural Gas TR Index is a single commodity subindex of the Bloomberg CI composed of futures contracts on Natural Gas. It reflects the return of underlying commodity futures price movements only and is quoted in USD. The Bloomberg Gold TR Index reflects the return on fully collateralized future positions. The Bloomberg Commodity Index (“BCOM”) is designed to be a highly liquid and diversified benchmark for commodity investments via futures contracts. These unmanaged indices do not reflect fees and expenses and are not available for direct investment.
In relation to any data attributed to Morningstar, please note the following: © Morningstar 2024. All rights reserved. Use of this content requires expert knowledge. It is to be used by specialist institutions only. The information contained herein: (1) is proprietary to Morningstar and/or its content providers; (2) may not be copied, adapted or distributed; and (3) is not warranted to be accurate, complete or timely. Neither Morningstar nor its content providers are responsible for any damages or losses arising from any use of this information, except where such damages or losses cannot be limited or excluded by law in your jurisdiction. Past financial performance is no guarantee of future results.
Investing entails risks and there can be no assurance that any investment will achieve profits or avoid incurring losses
Stock markets are volatile and equity values can decline significantly in response to adverse issuer, political, regulatory, market and economic conditions
Commodities Risk - The value of commodities investments will generally be affected by overall market movements and factors specific to a particular industry or commodity including weather, embargoes, tariffs, or health, political, international and regulatory developments.
Correlation is a statistic that measures the degree to which two variables move in relation to each other.
Roll yield is the return from adjusting a futures position from one futures contract to a longer-dated contract.
Negative carry is a situation in which the cost of holding a security exceeds the yield earned, resulting in a loss for the investor. Positive carry is a situation in which the cost of holding a security exceeds the yield earned, resulting in a gain for the investor.
Backwardation is when the current price of an underlying asset is higher than prices trading in the futures market.
A “60/40 portfolio” is guidepost portfolio for a moderate risk investor. Portfolio allocations of 60% to equities to seek capital appreciation and 40% allocation to fixed income help mitigate risk and offer potential income.
4162033
